.png)

Step 1. Grabbing the data
The repository of data can be found on GitHub.
I cloned the data repository into a folder locally:
git clone https://github.com/CSSEGISandData/COVID-19.git
Step 2. Having Python modules needed
I knew I would need to use Python to pull out the data I wanted from the .csv files that the repo contained. So I used pyenv and made sure that I had Python 3 installed and that the python pandas module was also installed. I would use Poser’s python later, but it doesn’t have the modules installed that I would need and on the Mac it is still Python 2.7.1.
Step 3. Decide on data format to read into Poser
The goal here was to convert the data I needed to a .json file in a format I could easily import into Poser’s python interpreter so that I could use it to create objects inside Poser.
I decided on this JSON file format to include name, longitude, latitude, and values:
{
  "locations": [
          {
             "name": "New York City...",
             "latitude" : 40.76727260000001,
             "longitude" : -73.97152637,
             "values" : [0,0,....., 98308, 103208, 106763]
          },

          {   "name": ...},

          {   "name": ...}
        ]
}
I won't put all the python code here but the important calls were:
import pandas as pd numBoxes = 1800 # Read the data data = pd.read_csv(time_series_covid19_confirmed_US.csv, sep=',') # Remove cities with zero and sort#the data by the most recent day as index#and the highest values to the top nonZeroSorted = data[data[dayID] > 0].sort_values(by=[dayID],ascending=False)jj=0 for index in range(numBoxes): name = nonZeroSorted.iloc[index]['Combined_Key'] latitude = nonZeroSorted.iloc[index]['Lat'] longitude = nonZeroSorted.iloc[index]['Long_'] for single_date in daterange(start_date, end_date): dateStr = single_date.strftime('%-m/%-d/%y') columnsWanted = [dateStr] activeCases = nonZeroSorted.iloc[index][columnsWanted] timeline[jj] = int(activeCases.values[0]) jj+1locations[index] ={ "name": name,"latitude": latitude,"longitude": longitude,"values": timeline }jsonData={'locations':locations}with open(jsonFileName, 'w') as outfile: json.dump(jsonData, outfile)
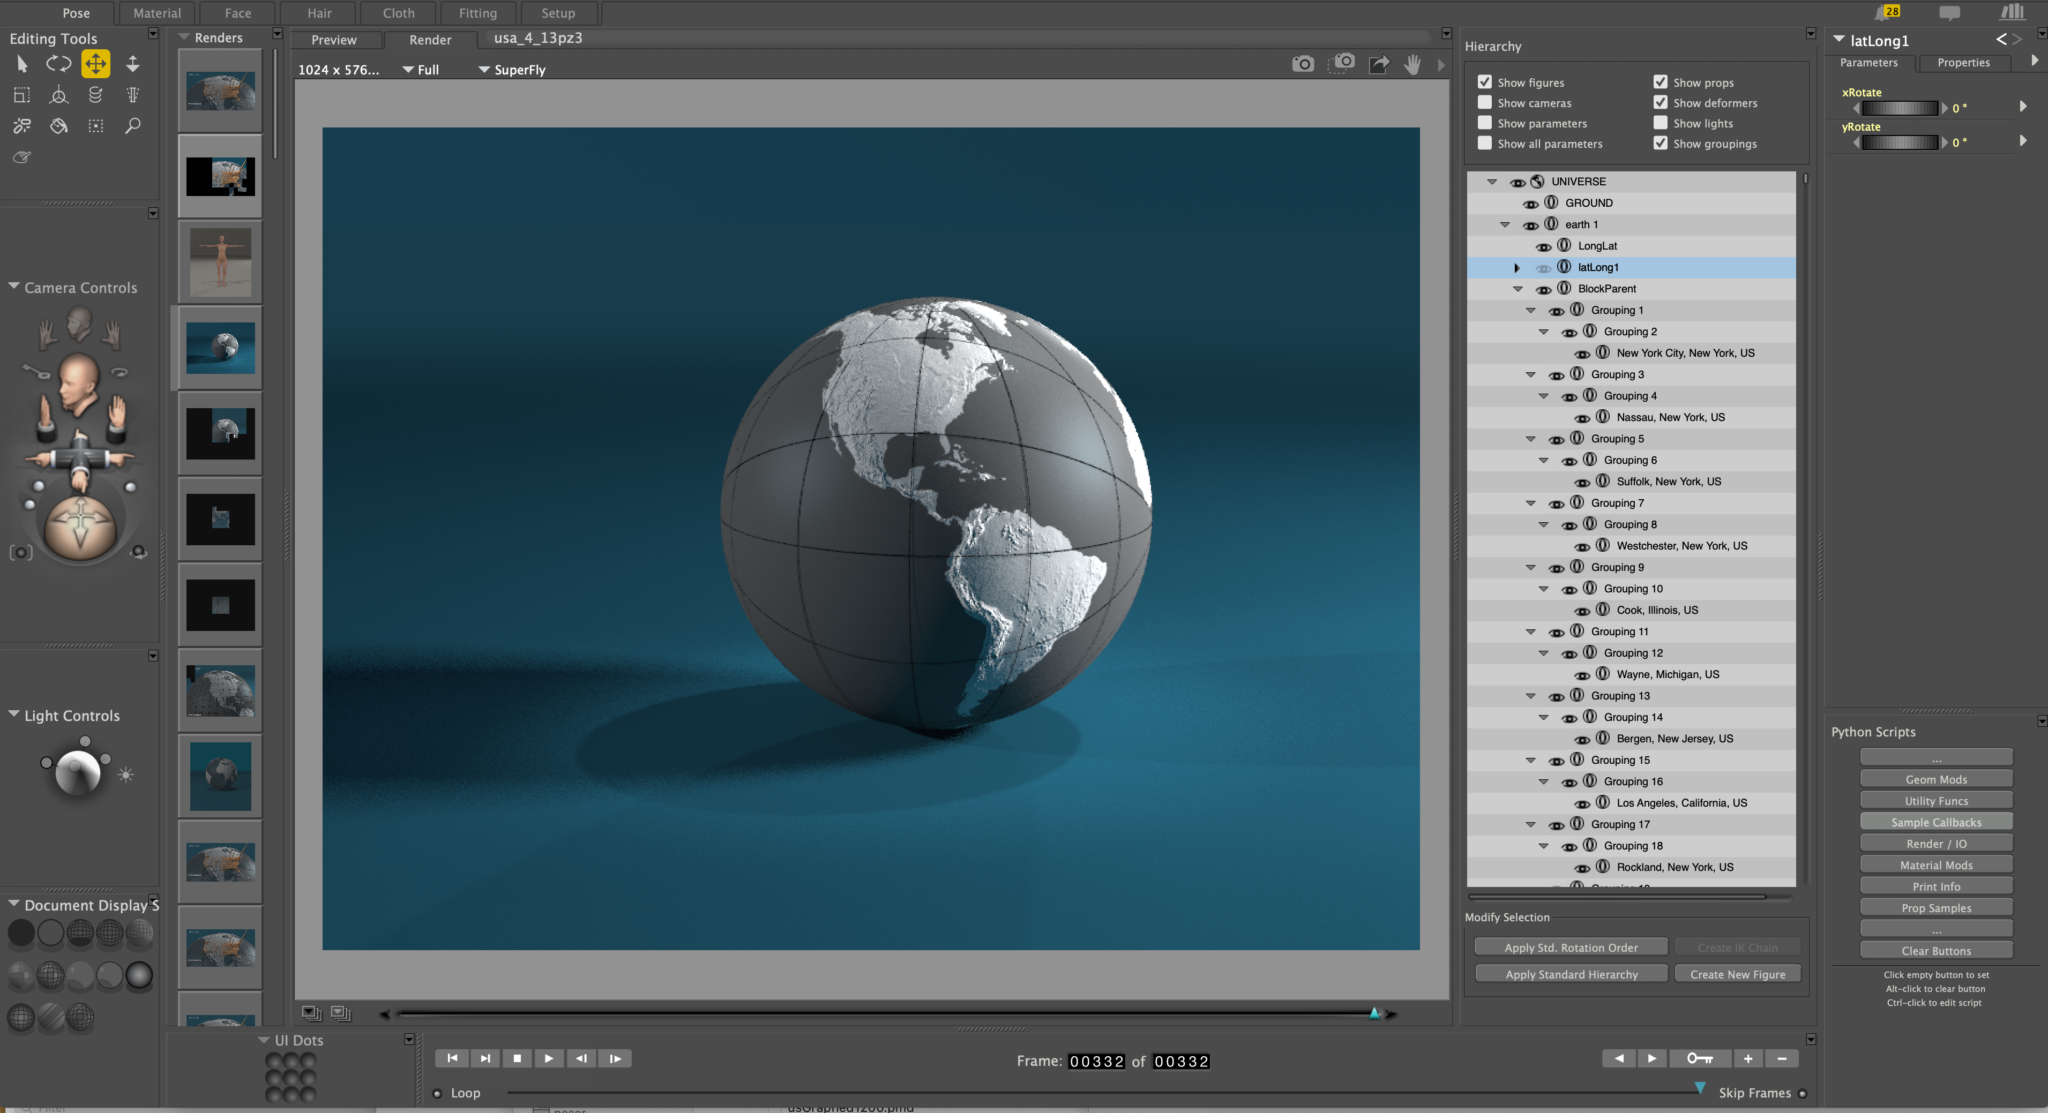
Step 4. Build a base Poser file with an Earth.
I built a base file in Poser using a properly spherically texture mapped sphere and was able to find some public earth textures I could start with. I eventually combined textures from multiple sources. The important thing is that they are accurate and that the longitude and latitude could be mapped to simple rotations on the rendered globe. There are many choices out there for earth textures. I subdivided the sphere to make sure it looked good up close. Textures I think I got here:
http://www.shadedrelief.com/natural3/
https://blog.mastermaps.com/2013/09/creating-webgl-earth-with-threejs.html
In the base file I also added an object that I would use as the geometry for the boxes. It's a simple 6 polygon box. I also added a grouping object I would use as a parent for the added boxes to make them easy to turn on and off.
I also experimented with parents on a box to get the correct order of z-scale, z-translation, x-rotation first and then y-rotation next, so I could directly map the longitude and latitude values.
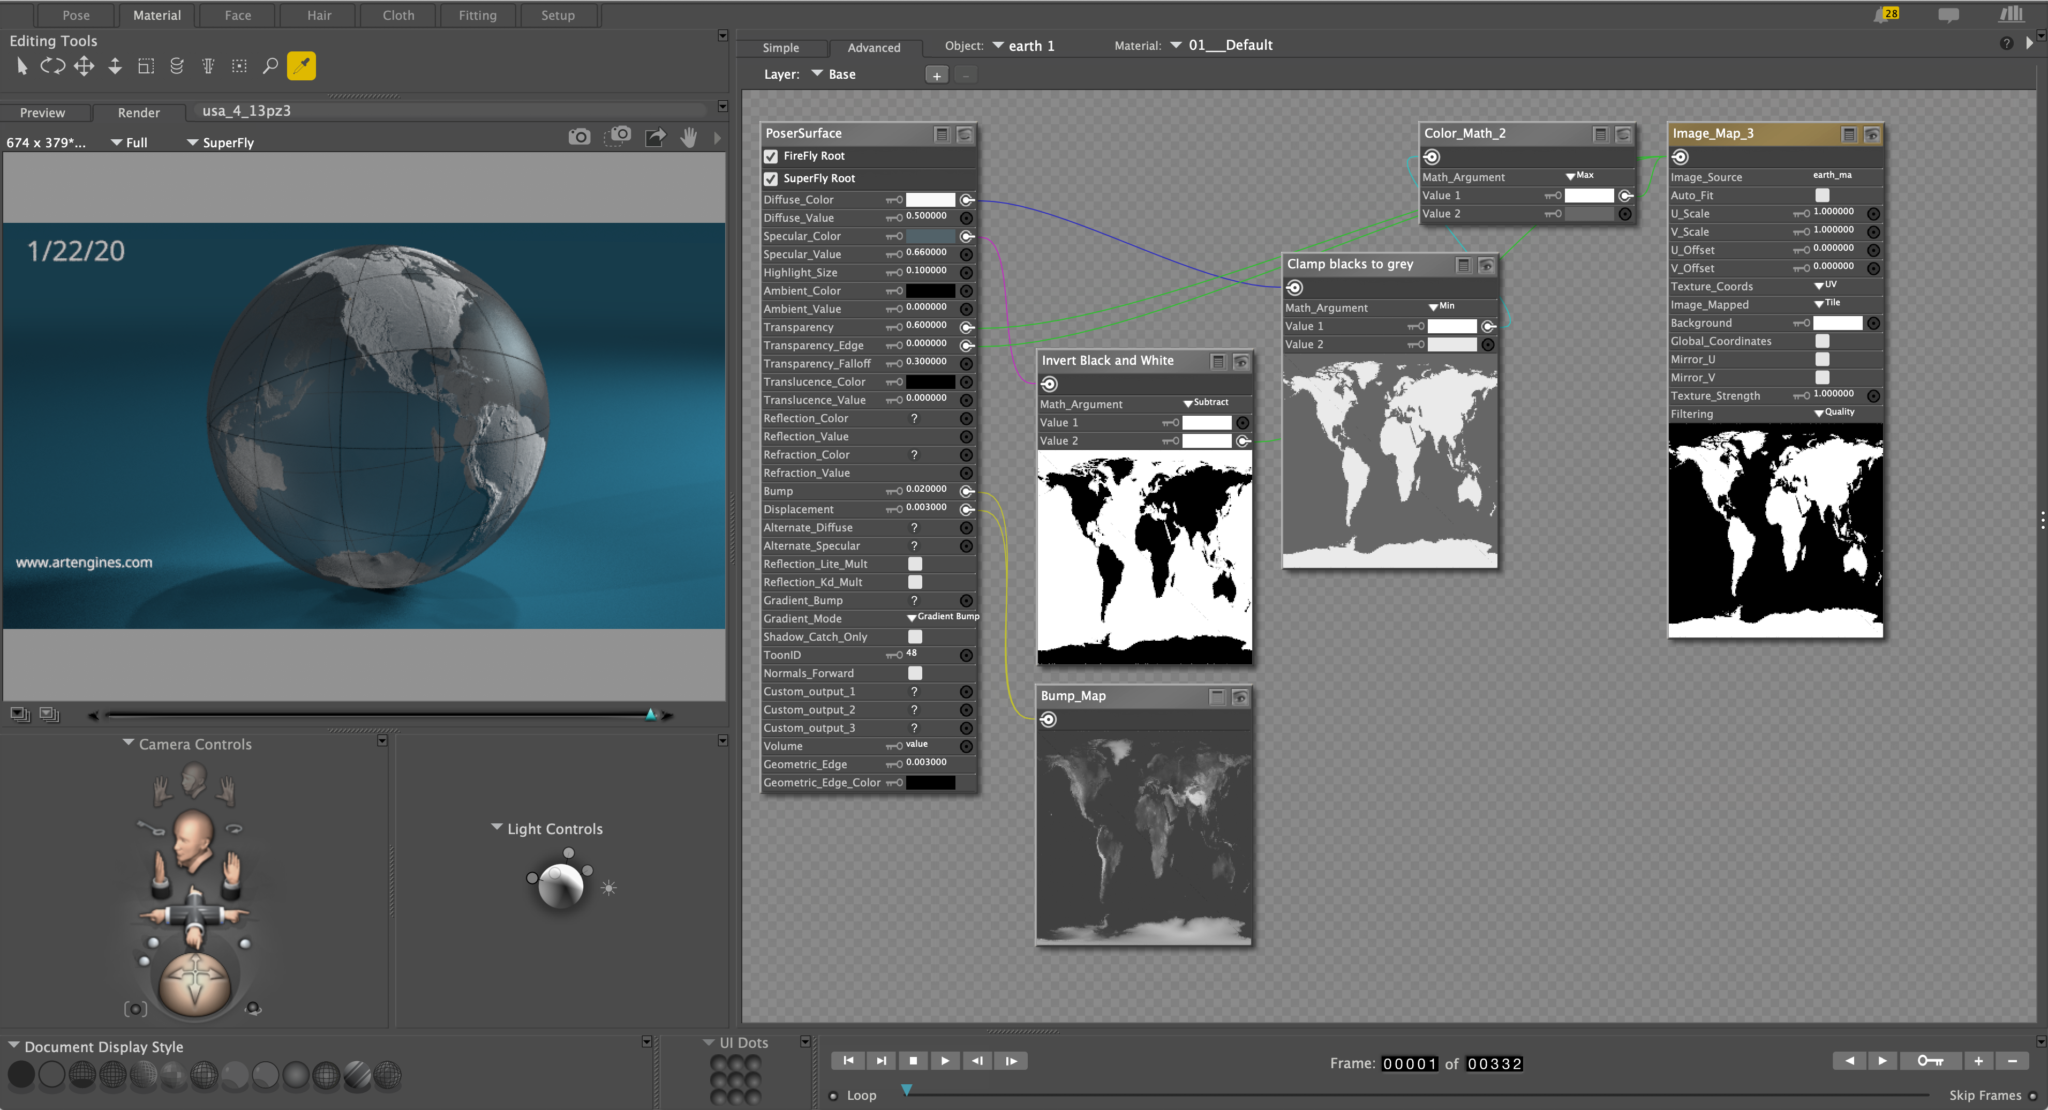
Here is a look at the materials in progress. This one has some transparency on the ocean areas. The main texture is color adjusted with shader nodes — made gray instead of black and white, and inverted for the transparency map:
Step 6. Build blocks on the earth from the data.
In order to build blocks on the earth, each block needs to be created with an origin at the bottom of the box, scaled in height (z scale), placed on the surface of the earth (translated in Z), then rotated through two parent rotations: X rot and then Y rot.
I used grouping objects inside Poser as the parents of each block
All of this was done using the Python scripting available inside Poser 11 Pro.
Here is the script that inputs the data from json and builds a block for each location. The time series values are read in and the z-scale channel is animated for each block.
import json
import random

numFrames=83
expand = 4
path = "topUS.json"
s = poser.Scene()

unitBox = s.ActorByInternalName("box_1")
unitBox.SetVisibleInReflections(0)
unitBox.SetVisibleInRender(0)
unitBox.SetVisibleInIDL(0)
unitBox.SetVisibleInCamera(0)
boxGeom = unitBox.Geometry()
earth = s.ActorByInternalName("earth 1")
s.SetNumFrames(1)

blockParent = None
try:
    blockParent = s.ActorByInternalName("BlockParent")
except:
    pass
if blockParent == None:
    blockParent = s.CreateGrouping()
    blockParent.SetParent(earth)
    blockParent.SetName("BlockParent")
    blockParent.SetVisibleInReflections(0)
    blockParent.SetVisibleInRender(0)
    blockParent.SetVisibleInIDL(0)
    blockParent.SetVisibleInCamera(0)
    blockParent.SetGeometry(poser.NewGeometry())

with open(path) as json_file:
    data = json.load(json_file)
    # For each location in the file:
    for location in   data[u'locations']:
        name = location[u'name']
        latitude = location[u'latitude']
        longitude = location[u'longitude']
        values = location[u'values'];

        numFrames = len(values)
        s.SetNumFrames(numFrames * expand)
        # Make a new box that we will animate later
        newBox = None
        try:
            newBox = s.ActorByInternalName(name)
        except:
            pass
        createNew = False
        if (newBox == None):
            createNew = True
            newBox = s.CreatePropFromGeom(boxGeom,name)
            newBox.SetOrigin(0.0, 0.0, -0.05)

        brightness = 1.1
        r = random.uniform(brightness*0.76,brightness*0.82)
        g = random.uniform(brightness*0.53,brightness*0.63)
        b = random.uniform(brightness*0.34,brightness*0.44)

        material = newBox.Materials()[0]
        tree = material.ShaderTree()
        material.SetDiffuseColor(r,g,b)
        node = tree.RendererRootNode(1)
        input = node.InputByInternalName("Diffuse_Color")
        input.SetColor(r, g, b )

        # Create longitude parent:
        if (createNew):
            longitudeActor = s.CreateGrouping()
            longitudeActor.SetGeometry(poser.NewGeometry())
            longitudeActor.SetVisibleInReflections(0)
            longitudeActor.SetVisibleInRender(0)
            longitudeActor.SetVisibleInIDL(0)
            longitudeActor.SetVisibleInCamera(0)
            longitudeActor.SetParent(blockParent)

            # Create latitude :
            latitudeActor = s.CreateGrouping()
            latitudeActor.SetGeometry(poser.NewGeometry())
            latitudeActor.SetParent(longitudeActor)
            latitudeActor.SetVisibleInReflections(0)
            latitudeActor.SetVisibleInRender(0)
            latitudeActor.SetVisibleInIDL(0)
            latitudeActor.SetVisibleInCamera(0)
            newBox.SetParent(latitudeActor)

            # Move the main parent:
            ytran = longitudeActor.Parameter("yTran")
            ytran.SetValue(0.34900001)

            # Set the latitude and longitude
            xrot = latitudeActor.Parameter("xRotate")
            xrot.SetValue(-latitude)
            yrot = longitudeActor.Parameter("yRotate")
            yrot.SetValue(longitude)

            # Move the box
            xtran = newBox.Parameter("xTran")
            xtran.SetValue(0)
            ytran = newBox.Parameter("yTran")
            ytran.SetValue(0)
            ztran = newBox.Parameter("zTran")
            ztran.SetValue(0.389)

        scale = newBox.Parameter("Scale")
        scale.SetValue(0.033)
        # For every frame set the scale channel value
        zscale = newBox.Parameter("zScale")
        for frame in range(0,numFrames):
            zscale.SetValueFrame(values[frame] / 700.0, frame)
            if (values[frame] <= 0):
                scale.SetValueFrame(0, frame)
            else:
                scale.SetValueFrame(0.033, frame)
Once I create this script in a text file, I opened the Python scripts palette and clicked on an empty button, so I could load the script into the button. The next click on the button would run it. I set the script up to run it again and it would be faster if the objects were already created inside Poser. It takes a while to build the scene the first time (and I tracked down some things that could speed this up for the future.)
Step 7. Retime the animation to slow it down.
At this point I needed a new feature that Poser didn't have. So I added it.
I wanted to retime the animation of everything in the scene so that I could spread the data points to more frames and interpolate between them. I added a radio button to retime everything in the scene. I guess I could have done this in the initial setting up of the keyframes too.
I then loaded some pre-saved camera animation from a camera library entry I created.
This was added to in the final Poser 11.3 update. ?
Step 8. Add the incrementing dates
Now I needed another Poser python script that could create the text objects for the dates that would need to increment. This was another missing feature in Poser — to be able to create a text prop from Python. It can be done interactively but there was no python function — so I added it! In the 11.3 coming out this week you will find CreateTextProp() on the poser scene object.
This python is a little sloppy and could probably be made simpler but this is what I used to create the numbers:
import random
import datetime
from datetime import timedelta, date

numDays = 83
expand = 4
numFrames = numDays*expand
s = poser.Scene()
dateParent = s.ActorByInternalName("DateParent")
date1 = date(2020, 1, 22)
date2 = datetime.datetime.today().date()
day = timedelta(days=1)
frame = 0
while date1 <= date2:
    dateStr = date1.strftime('%-m/%-d/%y')
    dateProp = s.CreateTextProp(dateStr, 0)
    dateProp.SetParent(dateParent,0,0)
    dateProp.SetVisibleInReflections(1)
    dateProp.SetVisibleInRender(1)
    dateProp.SetVisibleInIDL(1)
    dateProp.SetVisibleInCamera(1)

    # Set the materials material = dateProp.Materials()[0]
    tree = material.ShaderTree()
    node = tree.RendererRootNode(1)
    input = node.InputByInternalName("Ambient_Color")
    input.SetColor(1.0, 1.0, 1.0)
    input = node.InputByInternalName("Ambient_Value")
    input.SetFloat(0.5) scale = dateProp.Parameter("Scale")
    scale.SetValueFrame(0, 0)
    dateProp.SetRangeConstant(0,numFrames-1)
    if frame < numFrames:
        scale.SetValueFrame(2.5, frame)
    if frame+1 < numFrames:
        scale.SetValueFrame(2.5, frame+1)
    if frame+2 < numFrames:
        scale.SetValueFrame(2.5, frame+2)
    if frame+3 < numFrames:
        scale.SetValueFrame(2.5, frame+3)
    if frame+4 < numFrames:
        scale.SetValueFrame(0, frame+4)
    frame = frame + expand
    date1 = date1 + day
Then I rendered the sequence overnight.


