Using Graphs
The Graph Work Area consists of two axes and a graph. The horizontal axis represents time in frame numbers. The vertical axis’ values change depending on the selected attribute. If you choose a position attribute such as xTrans, the values represent positions in 3D space (Cartesian coordinates). If you select an editing property such as Bend, the axis represents degrees. A morph parameter’s values are measured in percentages.
The Graph itself shows the actual change in the attribute over the course of your animation. Its shape indicates the type of interpolation being used. You can also use the Graph palette for synchronizing sound to motion, as described in.
You will be given the option to save graph palettes when you save content to the Library, or when you save projects..
When you double-click a keyframe, the Graph palette for that keyframe appears. An element’s Graph palette allows you to perform precise edits on keyframes and modify the interpolation methods used in your animation. The Graph palette contains the following functions:
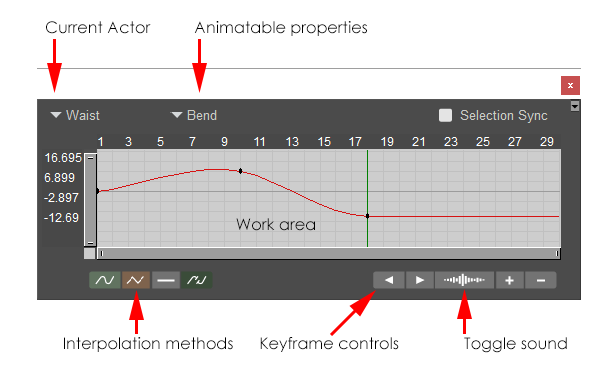
The Graph Palette.
Current Actor: Displays the actor that was controlled by the keyframe that you double-clicked to open the graph..You can expand the menu to select any other figure or actor in your scene.
Animatable Properties: The Animation Properties pull-down menu allows you to select one of the animatable properties for the currently selected element.
Selection Sync: Graphs are no longer locked to a single actor. When Selection Sync is enabled, the graph palette will change to the actor/parameter that you select in the scene or the animation palette. When disabled, the graph palette will not change to another parameter when you select one.
When Selection Sync is enabled, the actor/parameter popups in the graph palette will be disabled.
Interpolation Methods: See Selecting Interpolation Types.
Keyframe Controls: See Keyframe Controls.
Work Area: See Using the Graph With the Animation Palette.